6 Integrating Sustainable and Resilient Remediation Into Optimization
6.1 Introduction
| For more on sustainability and resiliency see ITRC’s Sustainability Resilient Remediation guidance document from April 2021, at: http://srr-1.itrcweb.org/ . |
This section provides information on how states can consider sustainability and resiliency during optimization efforts to improve the performance and protectiveness of a P&T system. Additionally, this section explains how the concepts of sustainability and resiliency are inherent in the optimization of P&T systems. Incorporating resiliency and sustainability during optimization encourages better utilization of energy, water, and other resources.
Resiliency and sustainability can be incorporated into P&T systems during the design phase, during operations, or during site close out. There is a mutually beneficial relationship between optimization and sustainability and resilience, and building in sustainability and resilience can further the optimization goals of improving the effectiveness and efficiency of the P&T system.

Optimization Life Cycle Navigation Diagram
Source: E. Madden, ITRC. Used with Permission.
This section looks at existing systems, systems that are being designed, systems that may be due for a technology change, and systems that are nearing their end point. The different types and phases of sites share common sustainability and resiliency considerations, and they each have specific sustainability and resiliency considerations. Sustainability and resiliency can be evaluated independently of optimization, but doing the work at the same time provides an efficiency opportunity to the project management team.
Brief descriptions of the subsections are provided below:
- Section 6.1 examines why and when optimization should consider resiliency and sustainability.
- Section 6.2 looks at the sustainability topic of water conservation.
- Section 6.3 discusses the sustainability of energy choices.
- Section 6.4 discusses the cost implications of implementing sustainable and resilient features in P&T systems.
- Section 6.5 provides a discussion of, and examples of, resiliency to climate change.
- Section 6.6 looks at the sustainability and resiliency of wells and collection systems.
- Section 6.7 discusses climate adaptation.
6.1.1 Key Terms
Resiliency and sustainability discussions have specific terminology. The key terms listed below will help the reader understand the discussions in this section:
- Adaptation: An adjustment, or preparation of, natural or human systems to a new or changing environment that moderates harm or exploits beneficial opportunities.
- Adaptive capacity: The ability of a system to adjust to climate change (including climate variability and extremes), to moderate potential damages, to take advantage of opportunities, or to cope with the consequences.
- Resilience: The ability to anticipate, prepare for, respond to, and recover from significant multi-hazard threats with minimum damage to human health and the environment.
- Sensitivity: The degree to which a system is affected, either adversely or beneficially, by climate variability or change. The change may be direct or indirect.
- Sustainability: The holistic consideration of environmental, social, and economic impacts of an activity and the evaluation of those impacts on future generations.
- Vulnerability: The degree to which a system is susceptible to, or unable to cope with, adverse effects of climate change, including climate variability and extremes. It is a function of the character, magnitude, and rate of climate variation to which a system is exposed; its sensitivity to those changes; and its adaptive capacity.
6.1.2 Survey of State Interest in Energy and Sustainability Issues
Of the respondents to the state survey, 29% said that sustainability/resiliency was a “primary concern or issue with their P&T Systems.” Furthermore, 42% said that receiving guidance on sustainability/resiliency recommendations was a “primary need.” For more on the survey results see Appendix E.
Question 5 in the survey was: “How is your agency currently evaluating your Pump & Treat System?” The question dealt directly with sustainability, resiliency, and energy issues. In total, 58 responses were received for this question, and energy efficiency and sustainability/resiliency were the least frequently selected responses. The results are shown in Table 6-1
Table 6-1 ITRC survey of state interest Question 5 results
| ANSWER CHOICES | RESPONSES |
| Performance data | 78% |
| Remedial endpoints | 67% |
| Pilot testing of alternative or enhanced remedy | 35% |
| Updating the Conceptual Site Model | 31% |
| Cost evaluation (e.g., dollars per gallon of water treated or constituent removed) | 29% |
| Modeling | 28% |
| My agency is currently not evaluating Pump and Treat systems | 10% |
| Sustainability/resiliency | 9% |
| Energy efficiency to reduce emissions/costs | 5% |
6.1.3 Remedy Selection—Is Pump and Treat a Resilient Remedy?
Incorporating resiliency and sustainability considerations into the P&T optimization process can begin during the remedy selection phase ( USEPA 2012 [Y7NCWKHT] USEPA. 2012. “Transmittal of the National Strategy to Expand Superfund Optimization Practices from Site Assessment to Site Completion.” Office of Superfund Remediation and Technology Innovation (OSRTI). https://nepis.epa.gov/Exe/ZyPURL.cgi?Dockey=P100GI85.txt. ). The primary goals of optimization (protectiveness, effectiveness, and efficiency) align with remedy selection criteria. This creates an opportunity to apply the lessons learned during prior optimizations to the remedy selection process ( USEPA 2022 [ZHVKLCQP] USEPA. 2022. “Cleanup Optimization at Superfund Sites.” U.S. Environmental Protection Agency, February. https://www.epa.gov/superfund/cleanup-optimization-superfund-sites. , USEPA 2020 [RLVPF7D5] USEPA. 2020. “Superfund Optimization Progress Report.” U.S. Environmental Protection Agency, Office of Land and Emergency Management, October. https://semspub.epa.gov/work/HQ/100002585.pdf. ). As of the 2020 USEPA Optimization Progress Report, the USEPA has conducted more than 250 optimization reviews and optimization-related technical evaluations. The USEPA shares this wealth of data ( USEPA 2022 [ZHVKLCQP] USEPA. 2022. “Cleanup Optimization at Superfund Sites.” U.S. Environmental Protection Agency, February. https://www.epa.gov/superfund/cleanup-optimization-superfund-sites. , USEPA 2020 [RLVPF7D5] USEPA. 2020. “Superfund Optimization Progress Report.” U.S. Environmental Protection Agency, Office of Land and Emergency Management, October. https://semspub.epa.gov/work/HQ/100002585.pdf. , USEPA 2016 [LMNQDJEW] USEPA. 2016. “What Is Optimization?” U.S. Environmental Protection Agency; Clean-Up Information Network. http://clu-in.org/Optimization/whatis.cfm. ) so it can inform optimization during the remedy selection process by identifying P&T challenges, what can be done to anticipate those challenges, and how to improve the P&T process from the beginning. The data can support the decision logic for selecting P&T, or enhanced P&T, or deciding against P&T. Making the right choice of remedy earlier in the life cycle has the most effect on the process ( ITRC 2004 [JKA62F2T] ITRC. 2004. “Remediation Process Optimization: Identifying Opportunities for Enhanced and More Efficient Site Remediation.” Washington, D.C.: Interstate Technology & Regulatory Council, Remediation Process Optimization Team. https://itrcweb.org/teams/projects/remediation-process-optimization. ). Considering resiliency and sustainability early in the life cycle will have the same advantage.
By examining past optimizations, the decision process can be used to select more sustainable alternatives by seeing what was effective and efficient on previous projects. Resiliency opportunities can be identified by reading the optimization reviews and collecting data on the historic threats, such as flooding, that may have impacted the site. The next optimization step is to forecast future climate change risks, such as projecting how fast groundwater is dropping in the vicinity of the site, whether new production wells (agricultural or supply) are in the planning stages in the surrounding area, etc. On the sustainability side, land-use plans for the vicinity of the site, such as whether new housing units are being planned or whether the zoning is changing, should be examined.
6.1.4 New Designs
Optimization is not limited to existing systems. Optimization can be applied during the design phase ( ITRC 2007 [VHP7LJCG] ITRC. 2007. “Improving Environmental Site Remediation Through Performance-Based Environmental Management.” Washington D.C.: Interstate Technology & Regulatory Council, Remediation Process Optimization Team. https://itrcweb.org/GuidanceDocuments/RPO-7.pdf. ). P&T systems are generally designed as long-term projects due to the nature of the systems’ goals. Optimizing the design to look at future potential environmental risks to the site (resiliency) and future potential impacts of the site on the environment or surrounding communities (sustainability) is important in at least two ways: (1) building in resiliency to threats up front is more cost-efficient than retrofitting and (2) the benefits of the resiliency measures will benefit the system for a longer time ( USEPA 2012 [Y7NCWKHT] USEPA. 2012. “Transmittal of the National Strategy to Expand Superfund Optimization Practices from Site Assessment to Site Completion.” Office of Superfund Remediation and Technology Innovation (OSRTI). https://nepis.epa.gov/Exe/ZyPURL.cgi?Dockey=P100GI85.txt. ). This allows the system to continue operating, providing environmental protection more consistently, and be more efficient, saving resources of all types.
6.1.5 Existing Systems
The subsection explains why resiliency should be considered when optimizing existing P&T systems. Existing systems are the “low-hanging fruit” of P&T optimization. They can exhibit two of the main criteria for selecting a project for optimization ( ITRC 2004 [JKA62F2T] ITRC. 2004. “Remediation Process Optimization: Identifying Opportunities for Enhanced and More Efficient Site Remediation.” Washington, D.C.: Interstate Technology & Regulatory Council, Remediation Process Optimization Team. https://itrcweb.org/teams/projects/remediation-process-optimization. ):
- concern that the current system is not achieving remedial goals effectively or efficiently (e.g., protectiveness of the remedy may be in question or the rate of progress toward achieving site cleanup criteria may be below expectations)
- high annual O&M costs associated with systems expected to operate for many years
Existing sites have a maintenance track record and operating data to examine. Regional and local site conditions have probably changed since the system was designed, built, and commissioned. There is plenty of data to work with when conducting the optimization evaluation, including sustainability and resiliency considerations. One example of a sustainability consideration is whether the end use for the property is the same as the end use identified during the design phase. One example of a resiliency consideration is whether more wildfire risks, such as an increase in the numbers of fires or drought conditions, exist today than during design and construction. Optimization reviews can address these and other questions presented below by retrofitting the remediation remedy for sustainability and resiliency. All the historic weather, climate, and land-use data available since the system was commissioned, as well as current projections, should be used to determine whether the resiliency or sustainability risk profile has changed.
6.1.6 Sustainability and Resiliency in Transition or Termination of Pump and Treat
During the end point of P&T systems (see also Clu-in’s Exit Strategy page and Section 5.5.3, Pump and Treat Termination), sustainability and resiliency concepts may be considered in the following ways:
- Recommend the evaluation of alternative technologies for sustainability and resiliency optimization at a cycle appropriate for the site. At extremely expensive or consumptive sites, reviews might be conducted annually. Energy reviews/audits might be conducted annually and larger process reviews at an alternate frequency. For smaller sites, it may be appropriate to conduct reviews at longer intervals.
- Technologies evolve over time, so when a more cost-effective and sustainable treatment technology is available and appropriate for the site, it should be discussed and considered. Revisiting the available technologies periodically can ensure that the most effective and sustainable system is deployed at a site. Changing, enhancing, or eliminating the P&T system itself may have sustainability impacts such as added costs, revised time frames, higher carbon footprint, etc. The financial and environmental returns on investment must be calculated.
6.1.7 Effectiveness versus Protectiveness
The effectiveness of the P&T system is defined as how well the system mechanically and chemically handles captured water and contaminants and treats or neutralizes the COCs. Protectiveness is how well the system prevents damage to human health and the environment and whether all pathways are considered and addressed (e.g., capture zones are complete, monitoring covers all threat pathways, etc.). Sustainability and resilience have a close relationship to effectiveness and protectiveness. Sustainability, the impact of the system on the environment around the site, is possible only if the P&T system is effective and is providing the protectiveness that was defined in the design. Resiliency, the adaptive abilities built into the P&T system, supports effectiveness by enabling the P&T system to continue to provide protectiveness in a range of operating environments. For more discussion on effectiveness and protectiveness in remediation systems, see the ITRC Sustainable Resilient Remediation document, Section 6 Integrating Resilience and Sustainability into the Remedial Project Life Cycle.
Options exist to incorporate resiliency and sustainability into P&T system design and operation during optimization. There is a certain symbiosis between optimization and building in sustainability and resilience. Incorporating sustainability and resilience can further the optimization goals of improving effectiveness and efficiency.
Optimization reviewers looking for ways to build in resiliency against current or future climate change risks need to evaluate site-specific conditions and forecasts of future conditions and needs. The main goal of optimizations, as stated earlier, is to ensure the protection of human health and the environment by assessing and implementing the most efficient and effective remediation systems.
6.1.8 Relationship between Resiliency and Sustainability
Long-term protection of human health and the environment and the sustainability that allows for timely project completion rely on building in an appropriate level of resiliency. If a system is rendered inoperable or grossly inefficient by climate risks, it will not be sustainable in the long run. For example, a P&T system may have been designed for continuous operation with a certain uptime expectation. That uptime goal might have been a reasonable expectation during the remedial investigation and design phase based on groundwater levels and aquifer recharge at the time. But sometimes decades later the system can no longer operate anywhere near the expected design uptime due to the lack of water in the recovery wells. (This example assumes excellent O&M practices have been in place.) Lower uptime means less water has been treated over the design lifetime, therefore extending the remediation timeline. This is a simplified example because the conditions will probably get progressively worse, causing further delays and increasing the costs of modifications needed to adapt to the changes. The following financial factors should be considered:
- The first consideration is how this affects the sustainability of the site. Would such a schedule delay be sustainable from a financial standpoint?
- Funding may have been established based on the original projection. Will there be additional funds available for the new schedule?
- Large corporations or potentially responsible party (PRP) groups may be able to afford such a cost, but could a small PRP afford it? Would the site default to the public to cleanup?
- Can the public afford to continue the cleanup? For publicly funded work, many states fund on a year-to-year basis; therefore, extending a P&T schedule from 50 years to 80 years may be untenable.
Another larger question about sustainability is whether the community will tolerate such a delay. The community developed expectations during the remedial process, and they may have concerns if they learn that a site may not reach its remediation goals for another generation. This type of delay may leave the property essentially vacant longer than expected, out of the hands of redevelopers, not available for conversion to public use (some park and recreation agencies will not take “contaminated” properties under any circumstance), or whatever best use was planned for the property. This is an example of one site; the states have the responsibility for an ever-increasing number of sites. Similarly, medium and large corporations may have a large portfolio of sites. Can they afford the increasing costs for this portfolio in the long term without raising costs to their customers? Can they afford to do that without losing business?
A potential solution to all these scenarios is optimization. By conducting optimization in an open manner, with all methods and assumptions open to review, the party conducting the optimization can try to mitigate the costs, time, and resources (e.g., water, energy, social) required for the remediation. They can prove that steps have been taken to identify project vulnerabilities and options to mitigate those project risks.
6.2 Sustainability—Water Considerations
Water is why P&T systems exist. Some of the most important considerations are the volume and rate of water being pumped, how contamination plumes are controlled, how the water is treated, and where the treated water is discharged. Sustainability, the impact of the site and site remediation on the environment, is keyed to water issues at P&T sites. This section examines the water issues that arise during optimization reviews. This is not intended to be a comprehensive listing of water-based sustainability topics; it is intended to provide approaches and resources that can be used in response to water challenges arising from changing conditions.
6.2.1 Sustainability Example—Water Conservation Through Reuse and Reinjection.
Pursuant to the USEPA green remediation guidance document “Incorporating Sustainable Environmental Practices into Remediation of Contaminated Sites” ( USEPA 2008 [CXB97RS9] USEPA. 2008. “Green Remediation: Incorporating Sustainable Environmental Practices into Remediation of Contaminated Sites.” U.S. Environmental Protection Agency, Office of Solid Waste and Emergency Response. ):
- “Treatment system designs also should compare the environmental footprint left by alternate methods of managing process water, whether through re-injection to an aquifer, discharge to surface water, or pumping to a publicly owned wastewater treatment plant. Effective designs maximize every opportunity to recycle process fluid, byproducts, and water; reclaim material with resale value; and conserve water through techniques such as installation of automatic shut-off valves. To reduce impacts on water quality, construction designs can follow [low impact development] practices helping to infiltrate, evapotranspire, and re-use stormwater runoff in ways mirroring the site’s natural hydrology.”
Considering the reuse or reinjection of groundwater treated by a P&T system is essential to preserve a natural resource for which there is increasing demand and dwindling supply. P&T sites may offer opportunities to provide source water for managed aquifer recharge (MAR) projects, which are the purposeful recharge of water to aquifers for subsequent recovery or for environmental benefit. P&T sites require both control of overland flow via storm water routing or capture and groundwater pumping to capture or manage contaminant plumes. Some remedial sites have on-site treatment in place where regulated effluents are of sufficient quality to allow for discharge to sanitary sewers or under a National Pollutant Discharge Elimination System (NPDES) permit. In such cases the effluent may require little additional treatment for use in MAR projects. The feasibility of sourcing water from remedial sites for MAR projects will be site specific and will likely require significant efforts to coordinate and evaluate the suitability, liabilities, and risks. State and federal agencies that operate or oversee these sites would be the primary stakeholder and could be engaged on the feasibility on a case-by-case basis. (Please see the December 2023 ITRC guidance on Managed Aquifer Recharge for more information.)
P&T systems also need to be assessed for other sustainability issues such as energy use, which can be increased to accommodate water sustainability. Examples include reinjection upgradient of extraction wells, which decreases the capture zone and thereby increases the required extraction rate (arguably the upgradient injection should shorten the duration of the remedy, but the shortening may not be realized for decades or centuries); water reuse, which may require more stringent or different treatment standards; and the manufacture and transport of amendments, which can be energy intensive. The potential sustainability considerations for P&T sites are listed below:
- Review the concentrations of both targeted and nontargeted constituents within treated water to determine whether the treatment of extracted groundwater is sufficient to allow the reuse or reinjection of the treated water. Compare the levels to permit limitations and regulations governing the discharge of treated groundwater and the regulations on reuse or reinjection for the discharge-receiving aquifer, surface water, sewer, or other discharge points.
- Review current standards to determine the impact on discharge options. Discharge permits include limitations on the quantity and quality of groundwater being reused or reinjected.
- Consider nontarget constituents of the treatment system when evaluating reuse or reinjection options.
- Consider reinjection as an option because it may reduce the need to install new, deeper extraction wells, therefore ensuring a more sustainable remedial option. This provides resilience by ensuring the groundwater table does not drop below groundwater screens, which would necessitate the installation of additional groundwater extraction wells and increase the associated carbon footprint and costs.
- Consider the lithology because it can limit the quantity of reinjected water. Some P&T treatment systems reuse groundwater as a drinking-water source following treatment and blending or as gray water for watering plants.
- Identify any air permits that may be needed for some treatment processes, such as air stripping.
- Amendments:
- Supplement P&T with ISCO/ISCR/bioenhancement amendments into the aquifer itself to reduce life cycle costs. It takes time for injected amendments to make their way through an aquifer. (Note that some amendments are designed not to move with the aquifer.)
- Mobile amendments are typically consumed at a relatively high rate compared to groundwater flow rates, and therefore a limited area around the point of application is typically treated.
- Where possible, optimize P&T by adding amendments to groundwater prior to reinjection to expedite remediation and reduce the life cycle of the remedy.
- Consider travel distances and fuel types when analyzing transportation and disposal options.
- Evaluate state- and regional-specific discharge, reuse, and reinjection requirements, which can vary widely.
- Conduct groundwater extraction and reinjection modeling based on SCADA systems.
- Conduct a sensitivity analysis. Sustainability evaluations can be qualitative or quantitative ( USEPA 2022 [6HJL8F9B] USEPA. 2022. “Green Remediation Focus: Former Ferdula Landfill.” U.S. Environmental Protection Agency; Clean-Up Information Network. https://clu-in.org/greenremediation/profiles/formerferdulalandfill. ).
- Ensure weather resilience for hot, cold, tropical, and extra tropical (for coastal areas) weather events and for humidity. Anticipate power outages, brown outs, or rolling blackouts.
- Use treatment train recirculation to improve removal/reduction of target COCs and reduce treatment costs without having to add new buildings or equipment (other than controls).
- Evaluate or reevaluate threatened and endangered species programs impacting the P&T remedy.
Various organizations provide guides for how to incorporate green and sustainable concepts into remediation processes. They may not specifically mention optimization, but they can still be applied to optimization. An example of available best management practice (BMP) guides are those produced by the ASTM International (ASTM). ASTM BMPs can be found in their “Standard Guide for Greener Cleanups” (ASTM E2893-13) and the “Standard Guide for Integrating Sustainable Objectives into Cleanup” (ASTM E2876-13)
Qualitative and quantitative evaluations for cost-benefit analyses of reinjection are available. The USEPA has issued numerous green remediation BMPs, including for P&T technologies ( USEPA 2022 [6HJL8F9B] USEPA. 2022. “Green Remediation Focus: Former Ferdula Landfill.” U.S. Environmental Protection Agency; Clean-Up Information Network. https://clu-in.org/greenremediation/profiles/formerferdulalandfill. ; USEPA 2021 [E7Y242ZI] USEPA. 2021. “Green Remediation Best Management Practices: Pump and Treat Systems.” U.S. Environmental Protection Agency, Office of Land and Emergency Management. https://www.epa.gov/system/files/documents/2022-02/gr_fact_sheet_pump_treat.pdf. ). Sources of USEPA green, sustainability and resiliency BMPs include the following:
- USEPA, Office of Land and Emergency Management, EPA 542-F-22-003—Green Remediation Best Management Practices: An Overview, April 2022.
- USEPA, EPA-542-F-21-029—Green Remediation Best Management Practices: Pump and Treat Systems, December 2021.
6.2.2 Sustainability Example—Pulse Pumping
Pulse pumping is a method of pumping that uses timing to allow the groundwater to recover between periods of pumping. Pulse pumping can be used on retrofitted existing wells or installed in a phased approach during optimization implementation. Pulse pumping can be used on one well, multiple wells, or a series of recovery wells located in different parts of the same site ( USEPA 2022 [27QJTZ3V] USEPA. 2022. “Considerations for Adaptive Management at Superfund Sites.” U.S. Environmental Protection Agency, Office of Land and Emergency Management. https://semspub.epa.gov/work/HQ/100003041.pdf. ). Pulse pumping has been installed at Superfund sites as a result of optimization studies ( USEPA 2017 [FG5YAG9V] USEPA. 2017. “Superfund Task Force Recommendations.” U.S. Environmental Protection Agency, July. https://www.epa.gov/sites/default/files/2017-07/documents/superfund_task_force_report.pdf. ).
Pulse pumping can be used to allow concentrations of contaminants to build up via diffusion ( USEPA 1996 [LPDXYRP7] USEPA. 1996. “Pump and Treat Remediation: A Guide for Decision Makers and Practitioners.” U.S. Environmental Protection Agency, Office of Research and Development. https://frtr.gov/matrix/documents/Groundwater-Pump-and-Treat/1996-Pump-and-Treat%20Ground-Water-Remediation.PDF. ). Another reason to use pulse pumping is to allow water levels to recover to allow pumping and not let the wells pump dry. This second reason can be used as a resiliency adaptation. If a system once pumped continuously but no longer has sufficient water, pulsing may allow for continued contaminated water recovery. Additionally, a pulse pumping system requires less water volume to extract the same, or more, mass of contamination; thus, it is a more sustainable option to the high-volume low-concentration pumping methods.
Pulse Pumping Considerations
|
Studies indicate that the first reason for pulse pumping, allowing for concentration rebound, may not be an effective strategy ( USEPA 1996 [LPDXYRP7] USEPA. 1996. “Pump and Treat Remediation: A Guide for Decision Makers and Practitioners.” U.S. Environmental Protection Agency, Office of Research and Development. https://frtr.gov/matrix/documents/Groundwater-Pump-and-Treat/1996-Pump-and-Treat%20Ground-Water-Remediation.PDF. ). You cannot capture what is not there; therefore, ensure that the wells, existing or new, are placed in the groundwater where the contaminants are present. Capture zones must be carefully evaluated to avoid allowing the plume, or part of the plume, to escape. Mechanical considerations may also limit the practical uses of pulse pumping; designing a timer system for pulse pumping, specifying the sensors and controls, and retrofitting existing well(s) or installing new wells all have costs. The existing system will need to be evaluated to determine whether the individual components and the unit operations can handle new flow rates (e.g., carbon vessel sizing is particularly sensitive to flow rate variation or changes). The optimization estimate should evaluate the payback time both from a return on investment and a project schedule impact basis. O&M can be reduced but not eliminated, and sensors and controls need scheduled maintenance and periodic replacement.
Something to Consider: If possible, time the pulsing to less-expensive power periods to capture additional savings and use the power supply more efficiently.
6.3 Sustainability and Green Energy
P&T systems can use tremendous amounts of energy. The process of pumping and treating contaminated water uses energy in many forms. This section examines a range of energy issues and how they can be built into optimization reviews. This is not intended to be a comprehensive list of opportunities and solutions, but it is intended to show optimization reviewers what energy issues are present at P&T sites and how to incorporate energy considerations into the reviews.
Energy savings are typically provided in one of two ways to existing P&T systems. One is to select or retrofit the system components, treatment strategy, or well-network design to reduce energy consumption. The other is to implement green energy systems specifically to reduce a P&T system’s dependence on fossil fuel–based energy. When designing a P&T optimization, consider the potential to incorporate passive energy systems, whether by using gravity drainage as much as possible, designing injection systems to allow gravity recharge, or considering the potential for passive solar gains to reduce the need for heating remediation system housing in the winter or using shading or pumped water to cool them in the summer. In this section, both strategies are addressed.
6.3.1 Retrofitting for Energy Savings
Pumping groundwater is a highly energy-intensive activity and is often the largest consumer of energy in a groundwater system ( USEPA 2009 [8F6DQD9W] USEPA. 2009. “Green Remediation Best Management Practices: Pump and Treat Technologies.” U.S. Environmental Protection Agency, Office of Solid Waste and Emergency Response, December. https://semspub.epa.gov/work/HQ/147210.pdf. ). Energy is expended for water extraction, conveyance, treatment, and distribution ( USEPA 2013 [QC3IBVC2] USEPA. 2013. “Strategies for Saving Energy at Public Water Systems.” U.S. Environmental Protection Agency, Office of Water. https://www.epa.gov/sites/default/files/2015-04/documents/epa816f13004.pdf. ). Implementing efficient pumping systems can reduce costs and energy consumption, such as correctly sizing pumps and motors, adjusting pumping rates, initiating the use of VFDs, and selecting the right type of pump.
Correctly sizing pumps and motors is a key step when optimizing P&T systems. Pump and motor efficiency may be improved by resizing pumps and motors that were overdesigned as a result of conservative engineering practices. As contaminant concentrations decrease over time, pumping rates may also be reduced, which may require a pump resizing. Resizing motors and pumps to readjust flow rates may save both energy and maintenance requirements ( USEPA 2013 [QC3IBVC2] USEPA. 2013. “Strategies for Saving Energy at Public Water Systems.” U.S. Environmental Protection Agency, Office of Water. https://www.epa.gov/sites/default/files/2015-04/documents/epa816f13004.pdf. ). In addition, standard efficiency motors can be upgraded with energy-efficient motors, such as motors with a National Electrical Manufacturers Association Premium® label ( USEPA 2009 [8F6DQD9W] USEPA. 2009. “Green Remediation Best Management Practices: Pump and Treat Technologies.” U.S. Environmental Protection Agency, Office of Solid Waste and Emergency Response, December. https://semspub.epa.gov/work/HQ/147210.pdf. ). There are a variety of pumps to choose from for extracting water from an aquifer. The selection of a pump depends on the hydrogeology of the site and pumping power requirements. See Table 6-2 for a summary of the different types of pumps.
Table 6-2 Summary of key aspects of pumps
| Type of Pump | Optimal Conditions | Considerations |
| Submersible Electric Pump (i.e., electric motor and pump) | Appropriate for wells yielding about 1.5 gallons per minute (gpm) or more. The preferred choice for flows >12 gpm from a well with depths to water exceeding 30 feet. |
|
| Aboveground Electric Pump (e.g., jet pump) | Used for shallow wells where the depth to water during pumping is not greater than about 25 feet. | |
| Electric Lineshaft Turbine Pump | For flows greater than 100 gpm with aboveground pumps and used for water supply. |
|
| Pneumatic Submersible | Typically suitable for wells with yields from 0 to 12 gpm where water is up to 300 feet deep. They are the preferred choice for extracting water at flow rates below 1.5 gpm when the water is more than 25 feet deep. |
|
| Vacuum Pump | Used when more than five well points are necessary to achieve extraction goals, the water is less than approximately 25 feet deep during pumping conditions, and groundwater is in a relatively low permeability formation. |
|
| Piston Pump | Used at deep, small-diameter, low-yielding wells, especially deep 2-inch monitoring wells that have been converted to extraction wells. |
|
Source: Adapted from USEPA (2005).
Additional factors to review are the power and electrical designs for the systems and the pumps. These may not be appropriately specified so the system works effectively or does not have issues when the system needs modifications or optimization. See Table 6-2 for key points to consider when specifying P&T system pumps.
|
Optimizing pumping rates to conserve energy depends on the hydrogeology of the site, groundwater directional flow, and groundwater availability throughout the year. If continuous pumping is not needed to contain the plume and maintain the rate of groundwater transfer and treatment needed to ensure a protective remedy, consider pulse pumping or reducing pumping rates rather than purchasing smaller pumps and motors. These methods are especially effective in aquifers with slow recharge or without water during certain parts of the year. It is also important not to draw water levels below the pump, to prevent pump burnout and extend the pump operation life. Reducing the pumping rate could also be effective in aquifers with excellent recharge to allow diffusion to concentrate the contaminant in groundwater. Additional gains in energy conservation may be possible by pumping during off-peak utility periods ( USEPA 2009 [8F6DQD9W] USEPA. 2009. “Green Remediation Best Management Practices: Pump and Treat Technologies.” U.S. Environmental Protection Agency, Office of Solid Waste and Emergency Response, December. https://semspub.epa.gov/work/HQ/147210.pdf. ).
Optimize extraction rate by conducting a thorough site investigation that evaluates accurate well placement and the suitable number of extraction wells ( USEPA 2009 [8F6DQD9W] USEPA. 2009. “Green Remediation Best Management Practices: Pump and Treat Technologies.” U.S. Environmental Protection Agency, Office of Solid Waste and Emergency Response, December. https://semspub.epa.gov/work/HQ/147210.pdf. ). The overall extraction rate can also be reduced by reinjecting treated groundwater downgradient of the P&T system to reduce the hydraulic gradient around the extraction wells. Recirculation techniques may also limit the migration of groundwater impacted by contaminants to downgradient locations, and as a result, limit the treatment area. Be aware that changes to extraction or injection rates are often regulatory considerations (see Section 7).
Other ways to improve the energy efficiency of a P&T system are available. In many applications, replacing flow-control valves by throttle with VFDs reduces a pump’s energy demand up to 50% while avoiding damage to mechanical equipment ( USEPA 2009 [8F6DQD9W] USEPA. 2009. “Green Remediation Best Management Practices: Pump and Treat Technologies.” U.S. Environmental Protection Agency, Office of Solid Waste and Emergency Response, December. https://semspub.epa.gov/work/HQ/147210.pdf. ). They also have superior control of water flow for pulse pumping. The pipe material also affects the efficiency of the pumping system. High-density polyethylene (HDPE) is the pipe material typically used for extraction systems, and it has properties that often make it preferable to alternatives ( USEPA 2005 [D6GXRVXA] USEPA. 2005. “Cost-Effective Design of Pump and Treat Systems.” U.S. Environmental Protection Agency, Office of Solid Waste and Emergency Response. https://www.epa.gov/sites/default/files/2015-04/documents/cost-effective_design.pdf. ). However, there are some situations where steel pipes may be more suitable, such as for chemical treatments for pipe cleaning and conserving heat generated from the water.
The Frontier Fertilizer Superfund Site in Davis, California, reduced energy consumption of its P&T system by implementing VFDs and a gravity-feed pipe system. The former 18acre industrial site was contaminated with pesticides, carbon tetrachloride, and other COCs in the groundwater and soil. In 1995, a P&T system consisting of 16 groundwater extraction wells and three GAC vessels was installed to remove the COCs from the groundwater. In 2004, the P&T system switched from a 10-horsepower pumping system to a gravity-feed pipe system for discharge of treated water to a municipal water treatment facility. The pipe material and installation cost approximately $20,000 in 2004 dollars. This transition resulted in a 25% reduction in energy demands and $7,000 (in 2004 dollars) of annual savings in electricity-related operating costs. In 2006, 16 groundwater extraction pumps were equipped with VFDs. This allowed for the pumps to change motor speeds to accommodate fluctuating demand, rather than pumping in an energy-consuming start-stop pattern. Near-term return on the $45,000 capital costs (in 2006 dollars) for the VFDs would be through stabilization of pump speed and water flow through the treatment process, as well as a reduction in equipment stress caused by frequent start-stop cycles. The P&T system’s implementations of VFDs and the gravity-feed pipe system resulted in an estimated 28,500 pounds of avoided carbon dioxide (equivalent) emissions per year ( USEPA 2015 [E2CCTGTI] USEPA. 2015. “Superfund Site: Frontier Fertilizer, Davis, CA.” U.S. Environmental Protection Agency, Office of Solid Waste and Emergency Response. https://cumulis.epa.gov/supercpad/cursites/csitinfo.cfm?id=0901554. ).
In an effort to improve the efficiency of extraction well operations at the Fernald Preserve in Harrison, Ohio, the United States Department of Energy (DOE) reevaluated the existing P&T system and implemented two improvements. The P&T system was designed for the removal of uranium from the Great Miami Aquifer to meet the USEPA 30 μg/L drinking-water standard. The site had issues with reduced well flow rates, which prevented the achievement of the design flow rates and lengthened the time required for final aquifer cleanup. Part of the solution to improving well flow rates included adjusting pump and motor flow rates, replacing flow-control valves with VFDs, and increasing pipe size where possible. Several oversized pumps and motors were changed from 24hour per day operation at 100 gpm to 8hour per day operation at 300 gpm to allow the pumps to operate closer to their design flow rates. Next, flow-control valves were replaced with VFDs, which also increased the gallons pumped per kilowatt hour by 5% to 10% at each well. Last, pipe sizes were increased to allow for more flow with less pressure drop. Thus, the multiple improvement actions resulted in operational efficiency and energy reduction ( Hooten et al. 2016 [PARTWVRU] Hooten, G., C. A. Glassmeyer, W. A. Hertel, and K. A. Broberg. 2016. “Efforts to Improve Efficiency of Extraction Well Operation at the Fernald Preserve, Harrison, Ohio – 16177.” US Department of Energy Office of Legacy Management. https://lmpublicsearch.lm.doe.gov/LMSites/7760-Fernald%20Preserve%20Extraction%20Wells%20-%202016.pdf. ).
BMPs for energy savings recommendations adapted from the USEPA’s “Green Remediation Best Management Practices: Pump and Treat Systems” ( USEPA 2021 [E7Y242ZI] USEPA. 2021. “Green Remediation Best Management Practices: Pump and Treat Systems.” U.S. Environmental Protection Agency, Office of Land and Emergency Management. https://www.epa.gov/system/files/documents/2022-02/gr_fact_sheet_pump_treat.pdf. ) fact sheet are listed below.
- Size pumps to meet the most frequent rather than the highest expected load level to avoid excessive pumping and associated efficiency loss.
- Size electric motors for their intended uses; a partially loaded motor is significantly less efficient than one operating at 75% or higher capacity. The National Electrical Manufacturers Association offers a standard regarding the use of high efficiency motors.
- Choose boilers, fans, and other equipment with energy-efficiency ratings certified by Energy Star.
- Choose furnaces, chillers, and boilers fired by recycled petroleum- or vegetable-based oil or by biomass sources such as agricultural and forestry residues.
- Install VFDs to set pumping flow rates rather than using valves to throttle the flows. A VFD could reduce a pump’s energy demand by as much as 50% while avoiding damage to connected mechanical equipment.
- Install waste-heat recovery equipment such as heat exchangers, ground or water source heat pumps, and mobile waste-to-heat generators. Such units can transfer heat among liquids, supply heated or cooled air, or convert waste heat to usable electricity.
- Insulate pipes and equipment tied to treatment steps that require heat.
- Rely on gravity flow where feasible to minimize the number of pumps required for groundwater transfer or effluent discharge.
- Use closed-loop rather than open-loop treatment processes to reduce the need for fresh water and raw materials and potentially improve treatment system efficiency. Recirculation can improve the hydraulics of your target groundwater system and provide an added degree of contaminant source control.
- Decommission wells screened in impermeable strata, which are inefficient for pumping.
- Integrate smart energy technologies and distributed energy resources to allow energy demand flexibility, optimize energy usage, and provide resilience to weather-related grid outages. Examples include advanced metering infrastructure, automated feeder switches, and voltage regulators combined with on-site solar and wind energy systems.
- Implement a telemetry system to reduce the frequency of site visits and responses to noncritical alarms.
- Use multi‐port sampling systems rather than well clusters to collect groundwater samples from multiple depths, which minimizes the number of monitoring wells that need to be installed.
6.3.2 Implementation of Green Energy Systems
P&T systems require loads of energy, mainly in the form of fossil fuels, especially when the remedy expects to have long-term operations. From groundwater extraction to treatment methods, such as air stripping and off-gas treatment, the P&T process is heavily energy dependent. Thus, the application of green energy systems will reduce not only a site’s environmental footprint, but also its dependence on fossil fuel energy. Relying more on green energy systems also creates resiliency to climate change and promotes sustainability. Remote sites are particularly susceptible to falling power lines during a storm, which can cause critical power outages. A local energy source, in the form of solar or wind, can preclude the dependence on and maintenance of far-reaching power or gas lines. Additionally, the installation of green energy systems can create an added benefit to the community while the remediation is underway, or even after the remediation is complete.
The RePowering America Mapper shows users the renewable energy potential (including solar, wind, geothermal, and biomass) at more than 130,000 contaminated sites across the country.
This section focuses on renewable energy systems installed on site. It is now common for utility companies to have renewable energy options at an extra cost per kWh, in addition to the standard fossil fuel option. According to the DOE’s Buying Clean Electricity website, “At least 50% of customers have the option to purchase renewable electricity directly from their power supplier, and everyone has the option of purchasing renewable energy certificates. Such power is sometimes referred to as ‘green power’ or ‘clean power.’” More information can be found on the different kinds of green power purchasing programs on the DOE’s website.
6.3.2.1 Utilizing Solar Energy in Pump and Treat Systems
Utilizing solar energy could be a potent strategy to meeting a P&T system’s energy demand and strengthening the site’s resiliency to climate change, especially in remote areas where energy distribution is limited or populated areas where energy demand is high. Solar power can be captured by photovoltaic (PV), solar thermal, and concentrating solar power systems for production of electricity or direct power needed for site cleanup.
A micro-scale example of how solar panels could be used to pump water is the Lake City Army Ammunition Plant near Kansas City, Missouri. Five solar-powered skimmer pumps were used to recover approximately 200 gallons of NAPL from depths reaching 180 feet. Each pump was powered by a 65-watt PV panel, which could be transferred from one well to another, if needed. The recovery system operated completely off-grid, which bolsters its resilience to power outages and climate change ( USEPA 2011 [ANCUW35E] USEPA. 2011. “Green Remediation Best Management Practices: Integrating Renewable Energy into Site Cleanup.” U.S. Environmental Protection Agency, Office of Land and Emergency Management. https://www.epa.gov/sites/default/files/2015-04/documents/integrating_re_into_site_cleanup_factsheet.pdf. ). Currently, this same installation uses solar panels for the electricity needed for an electrokinetic amendment delivery transition strategy.
The Frontier Fertilizer Superfund Site in Davis, California, also successfully implemented a small-scale PV system. An average of 1.54 million gallons of groundwater was extracted monthly and treated via three GAC vessels to remove an average of 0.7 pounds of COCs each month and a total of about 1,500 pounds since 1995. In 2007, a $35,000 5.7-kW PV array was installed on the roof of the building housing the GAC vessels. The rooftop PV array generated about 8,000 kWh annually. In 2010, the P&T system added a ground-mounted PV system, which generated around 101,125 kWh each year. The combined solar energy production totaled approximately 109,125 kWh each year, which met 100% of the groundwater treatment’s energy demand.
The site anticipated a 14-year return on the $350,000 (in 2010 dollars) investment for the ground-mounted PV system, which was funded by the American Recovery and Reinvestment Act. USEPA Region 9 also received $100,000 (in 2010 dollars) from the California Energy Commission’s Renewable Energy Program. An annual savings of $12,000 was due to avoided operating expenses through PV-system net metering with the local electricity provider, based on 2014 electricity prices. Substitution of fossil fuel–generated electricity with the on-site renewable energy reduced approximately 119,000 pounds of indirect emission of carbon dioxide (equivalent) each year over the PV system’s anticipated 20-year lifespan. Thus, implementing PV systems to supply energy to a P&T system reduced electricity costs and carbon dioxide emissions ( USEPA 2015 [E2CCTGTI] USEPA. 2015. “Superfund Site: Frontier Fertilizer, Davis, CA.” U.S. Environmental Protection Agency, Office of Solid Waste and Emergency Response. https://cumulis.epa.gov/supercpad/cursites/csitinfo.cfm?id=0901554. ).
Several solar technologies can also be used for building operations, such as to power lights, ventilate a building, and provide heating ( USEPA 2009 [8F6DQD9W] USEPA. 2009. “Green Remediation Best Management Practices: Pump and Treat Technologies.” U.S. Environmental Protection Agency, Office of Solid Waste and Emergency Response, December. https://semspub.epa.gov/work/HQ/147210.pdf. ). The basic natural processes used in passive solar energy include thermal energy flow associated with radiation, conduction, and natural convection. That is, when sunlight strikes a building, the building materials reflect, transmit, or absorb the solar radiation. This can be done in several ways. Through passive solar heating, the building’s element retains the sun’s heat and releases the heat during periods when the sun is not shining. In a direct-gain solar passive heating system, the glass admits solar energy into the building where it will strike directly and indirectly thermal mass materials, such as masonry floors and walls. Around 60%–75% of the sun’s energy will be absorbed during the daytime and radiated back into the living space during the nighttime. The glass has to face south for the Northern Hemisphere and north for the Southern Hemisphere. Indirect-gain solar passive heating systems, such as a thermal storage wall system (e.g., a Trombe wall), water wall, or roof pond system, use thermal mass to absorb, store, and distribute heat ( Chel and Kaushik 2018 [3J4PHMXL] Chel, Arvind, and Geetanjali Kaushik. 2018. “Renewable Energy Technologies for Sustainable Development of Energy Efficient Building.” Alexandria Engineering Journal 57 (2): 655–69. https://doi.org/https://doi.org/10.1016/j.aej.2017.02.027. ). Therefore, for buildings that house P&T systems, utilizing solar design can improve resource efficiencies and conservation.
Potential savings opportunity: PV systems may provide an opportunity for savings in Power Purchase Agreements. See the DOE’s website for more information.
6.3.2.2 Wind in Pump and Treat
Wind energy is used in one of two ways on P&T remediation sites: (1) The wind turbine may mechanically drive the vacuum for pumping operations and (2) wind turbine–derived electricity is used to power efficient pump systems and other site utilities.
Some renewable energy systems are designed to operate on- or off-grid to accommodate changing site conditions or project constraints. Production of excess energy can result in financial benefits (such as utility net metering) and may affect decisions regarding grid-intertie. At the former Nebraska Ordnance Plant in Mead, Nebraska, for example, a 10-kW wind turbine powers groundwater circulation wells used for air stripping and UV treatment. The system reduces consumption of utility electricity by 26% during grid-intertie mode but can also operate off-grid when needed. Over 15 years, the electricity savings could exceed $40,000. Estimates at the time of wind turbine installation (2003) suggested that a similarly sized system operating fully off-grid would cost approximately $45,000 ( USEPA 2020 [9RXNNCTI] USEPA. 2020. “Green Remediation Focus: Former Nebraska Ordinance Plant.” U.S. Environmental Protection Agency; Clean-Up Information Network. https://clu-in.org/greenremediation/profiles/formernop. ).
Wind energy is used at the Former Ferdula Landfill site in Frankfort, New York. There, equipment for managing extraction of the landfill gas and operating the on-site windmill is housed inside a 150 square foot building adjacent to the windmill (Figure 6-1).
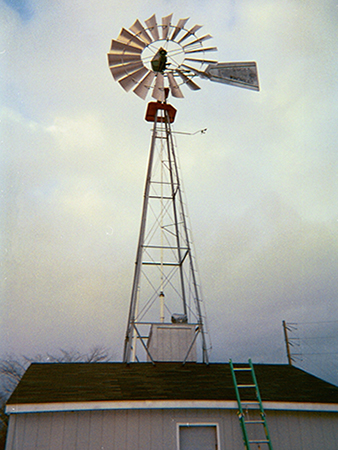
Source: USEPA 2022 [6HJL8F9B] USEPA. 2022. “Green Remediation Focus: Former Ferdula Landfill.” U.S. Environmental Protection Agency; Clean-Up Information Network. https://clu-in.org/greenremediation/profiles/formerferdulalandfill. .
Operation of three on-site, grid-tied wind turbines offsets about 60% of the electricity used to extract contaminated groundwater at the 183-acre Continental Steel Corporation site in Kokomo, Indiana. The extraction system uses 16 wells from which water is continuously extracted at a rate of up to 266 gallons per minute. Additional renewable energy is produced on site by a 7.2megawatt solar farm, which generates $36,000 in annual revenue for the City of Kokomo ( USEPA 2021 [E7Y242ZI] USEPA. 2021. “Green Remediation Best Management Practices: Pump and Treat Systems.” U.S. Environmental Protection Agency, Office of Land and Emergency Management. https://www.epa.gov/system/files/documents/2022-02/gr_fact_sheet_pump_treat.pdf. ).
Joint Base Cape Cod (JBCC, formerly known as the Massachusetts Military Reservation) provides facilities for the Air National Guard, the Massachusetts Army National Guard (ARNG), the U.S. Space Force, the U.S. Coast Guard, the Veterans Affairs Cemetery, and others ( AFCEC 2019 [4GWBINZW] AFCEC. 2019. “Joint Base Cape Cod Cleanup Update.” Preprint, U.S. Department of Defense, Air Force Civil Engineer Center at Joint Base Cape Cod. https://www.massnationalguard.org/JBCC/afcec-documents/FINAL%20PLUME%20BOOKLET%20High%20Quality%201SEP21-1.pdf. AFCEC 2021 [DAWZYL95] AFCEC. 2021. “AFCEC Plume Booklet.” Preprint, U.S. Department of Defense, Air Force Civil Engineer Center at Joint Base Cape Cod. https://www.massnationalguard.org/JBCC/afcec-documents/FINAL%20PLUME%20BOOKLET%20High%20Quality%201SEP21-1.pdf. ). The Environmental Restoration Program is under the United States Air Force (Air Force), which is addressing 18 groundwater plumes, four of which have been cleaned up as the contamination is now below applicable standards. Six Installation Restoration Program (IRP) treatment systems are currently treating approximately eight million gallons of groundwater per day, and those systems and the groundwater in the area of each plume are regularly monitored to verify that cleanup goals are being achieved. The Air Force owns and operates three 1.5-megawatt wind turbines; one has been operating since 2009 and the other two since 2011. Collectively, they offset 100% of the power used by the treatment systems. The Air Force JBCC get credit for the electricity that is put back into the grid. The offset of fossil fuel or other carbon sources equates to air emission offsets of 3,636 tons of CO2, 6,141 pounds of NOx, 465 pounds of PM10, 22,787 pounds of SO2, and 282 pounds of VOCs, according to the average usage of power source in Massachusetts for 2021. The program continually looks at ways to optimize system operations and cleanup actions and will be working with state and federal regulators to determine when cleanup efforts are complete and systems can be shut down ( USEPA 2010 [4UEWBDJ5] USEPA. 2010. “Green Remediation Focus: Massachusetts Military Reservation.” U.S. Environmental Protection Agency; Clean-Up Information Network. https://clu-in.org/greenremediation/profiles/mmr. ).
6.3.2.3 Geothermal in Pump and Treat
Perhaps the greatest opportunity for expanding the use of renewables in P&T systems lies in geothermal. Geothermal provides continuous baseload energy. The RePowering America program surveyed more than 110,000 sites nationwide with geothermal potential, mainly in the form of ground-source heat pumps. Ground-source heat pumps or direct-use geothermal can readily employ existing infrastructure at P&T sites, namely pumps, wells, and water pipes, dramatically reducing installation costs. Geothermal heat energy, once extracted in the form of groundwater, can serve as beneficial district heating and cooling for the local community. Most aquifers in a P&T remediation scenario will not have the temperatures required for electricity generation (>80°C for advanced systems).
A geothermal heat pump can extract heat from the groundwater to heat or cool indoor air, or it may employ another “working fluid,” like a refrigerant, to transfer heat to the space or process that requires it.
At the Lawrence Aviation Industries site in Port Jefferson Station, New York, they applied geothermal from the pumped water to heat and cool their treatment plant buildings. This resulted in energy savings and increased the value of the property when it is sold. They installed a single 1.5-ton geothermal heat exchange unit connected directly to the wellhead assembly. At each building, the extracted groundwater is immediately routed to the heat exchanger from which heated or cooled air (during winter or summer seasons, respectively) is transferred to the building ductwork at an average rate of 600 standard cubic feet per minute. Temperatures of the extracted groundwater average 56°F. The geothermal system avoids 6,000–7,000 kWh of grid-supplied electricity at each plant every year, which translates to a savings of $1,300–$1,700 annually (see the Lawrence Aviation Industries Case Study).
At the Phoenix-Goodyear Airport Area Superfund site in Arizona, an off-site closed-loop heat exchange system uses groundwater that is extracted and treated. They reuse approximately 197 million gallons of treated water each year to operate a heat exchanger at the Saint Thomas Aquinas Grade School. The closed-loop heat exchanger conditions cooling water and reduces the building heating and cooling costs by an estimated 40%. Costs to construct the approximate 2mile pipeline for conveying the treated water were covered by the Crane Company. Process water discharged from the heat exchanger and the remaining treatment system effluent are injected into the aquifer for plume containment through five injection wells (see the Phoenix-Goodyear Green Remediation Case Study).
Figure 6-2 shows possible areas where heat can be used at site remediation projects.
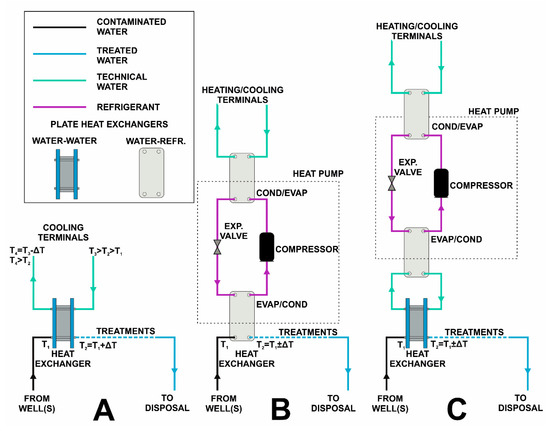
Source: Casasso et al. 2020 [CWYIPJ2T] Casasso, Alessandro, Tiziana Tosco, Carlo Bianco, Arianna Bucci, and Rajandrea Sethi. 2020. “How Can We Make Pump and Treat Systems More Energetically Sustainable?” Water 12 (1). https://doi.org/10.3390/w12010067. .
Denmark and the Netherlands have demonstration projects that use waste heat from buildings with a heat pump system to increase temperatures in an aquifer. This increases the efficiency of biodegradation reactions and desorption of NAPL ( Wageningen University 2015 [UJXUFR8J] Wageningen University. 2015. “Faster Groundwater Remediation with Thermal Storage.” https://www.wur.nl/en/show/Faster-groundwater-remediation-with-thermal-storage.htm. ).
6.3.2.4 Alternative Fuel Blends
The potential for direct use of alternative fuel blends for P&T optimization is likely limited to generator fuel or site vehicle fuel. Many electric utilities also provide the option of purchasing power generated using alternative fuels.
For a comprehensive list of projects that are upgrading gas for pipeline injection or use as vehicle fuel, see the Renewable Natural Gas Database developed and maintained by Argonne National Laboratory. Although these types of biologically generated fuels are renewable, they still release carbon dioxide at rates comparable to fossil fuels.
Table 6-3 provides a summary of renewable energy implementation at environmental remediation projects that use or have used P&T remediation. For additional information on any of these sites, the USEPA CLU-IN website provides green remediation profiles at https://clu-in.org/greenremediation/profiles.
Table 6-3 Use of renewable energy at pump and treat sites
| Case Study | Location | Solar | Wind | Geo-thermal | Usage Details | Cost Considerations |
| Travis Air Force Base | California | X | Many installations: recirculation pump, conveyance to phytoremediation system, pumps for P&T, and monitoring. |
Reduce electricity usage by an estimated 790,000 kWh using optimization strategies for pumps extracting or recirculating or by using other methods, such as subgrade biogeochemical reactors and phytoremediation, in conjunction with off-grid solar arrays, avoiding 920 tons of greenhouse gases. |
||
| Pharmacia and Upjohn | Connecticut | X | Used solar-powered air-monitoring equipment for 2012 pilot-scale ISTR transition from P&T and planned for full-scale. |
Cost data not currently available. | ||
| BP Site | New Jersey | X | A 275 kW solar field placed on landfill provided 5%–10% of power needs for groundwater extraction system. |
Reuse of site as a port was anticipated to yield 2,500 full time jobs and $5–$10 million in 5 years. |
||
| Jet Propulsion Laboratory | California | X | Solar system installed that generates ~870,000 kWh energy annually; 20% of system electricity consumption is provided by solar (good in case of emergency). |
System optimization reduced capital costs by $400,000, avoided $50,000 in annual operating costs, and avoided 165 tons of GHG. |
||
| Altus Air Force Base | Oklahoma | X | Use of 200 watt PV solar-powered array for recirculation groundwater wells through bioreactor; also avoided grid connections and maintenance. |
The backup generator system cost roughly $4 million but cost Altus Air Force Base nothing upfront. |
||
| Former La Croix Aluminum | U.S. Virgin Islands | X | X | Between 2002 and late 2011, four wind-driven electric generators (turbines), four wind-driven turbine compressors, and PV arrays were installed incrementally. Since late 2011, all of the remediation electricity requirements have been met by PV arrays used to power four submersible pumps for total fluids recovery and six solar-powered skimming pumps that predominantly recover hydrocarbons. Both systems function in unison; because the PV arrays are modular, they and the wind turbines can be reused. |
As of June 30, 2016, avoided more than $100,000 in capital costs to connect to the electrical grid and recovered approximately 493,000 gallons of free-product oil (approximately 40% of the estimated volume) from approximately 70 million gallons of extracted groundwater, which is sent to the reclamation facility. |
|
| Continental Steel | Indiana | X | X | Three 2.4 kW wind turbines and solar energy are used to power fluid extraction systems. | The city receives $36,000 in revenue from leasing the land for the solar farm. Up to 60% of grid electricity requirements are offset by using wind turbines. |
|
| Former Nebraska Ordnance Plant | Nebraska | X | X | Use of 10 kW wind turbine and 25 kW PV array to reduce off-site electricity requirements. | Reduced energy requirements of recirculation system by 27% using off-site turbine to generate 535,700 kW hours of electricity with an anticipated cost savings of $90,000 over 10 years. |
|
| Massachusetts Military Reservation | Massachusetts | X | Optimized for power usage of the P&T system first in order to solely use wind power. | According to the 2021 AFCEC Plume Booklet for the Installation Restoration Program at JBCC, the Air Force owns and operates three 1.5 megawatt wind turbines that offset 100% of the power used by the treatment systems (more than $1 million dollars in savings annually). |
||
| Lawrence Aviation Industries | New York | X | Minimized heat loss in groundwater extraction wells with well design. Used geothermal energy in water treatment system buildings. |
Avoided 6,000–7,000 kWh of grid-supplied electricity annually, which translates to avoiding $1,300–$1,700 in annual electricity costs and 4.1–4.8 metric tons of annual GHG emissions. |
||
| Pheonix-Goodyear Airport | Arizona | X | Using extracted P&T water as the working fluid in a geothermal ground-source heat pump for a local school. |
Saves the school 40% in heating and cooling costs. Saves the site approximately $250,000 in purchases from the water supplier and avoids approximately $75,000 in Arizona groundwater replenishing fees. |
Sources: USEPA Green Remediation (https://clu-in.org/greenremediation/profiles) and ITRC SRR (https://srr-1.itrcweb.org/appendix-a).
Notes: AFCEC = Air Force Civil Engineer Center, GHG = greenhouse gas, ISTR = in situ thermal remediation, JBCC = Joint Base Cape Cod, kWh = kilowatt-hour, P&T = Pump & Treat, PV = photovoltaic, USEPA = United States Environmental Protection Agency.
6.4 Cost-Efficiency in Sustainable Resilient Remediation
Sustainability is tied to efficiency; one of the key metrics of efficiency is the cost of the remedial action. Cost-efficiency in groundwater remediation is the act of changing a process to achieve remedial action objectives and remedial goals with lower expenditures of resources. Some sites measure efficiency in dollars per pound of contaminant recovered, reduced, or removed or dollars per gallon of water treated ( USEPA 2001 [8J2H4QEI] USEPA. 2001. “Cost Analyses for Selected Groundwater Cleanup Projects: Pump and Treat Systems and Permeable Reactive Barriers.” U.S. Environmental Protection Agency, Office of Solid Waste and Emergency Response. https://www.epa.gov/sites/default/files/2015-04/documents/cost_analysis_groundwater.pdf. ). Evaluating these data over time gives optimization reviewers important data on system performance. Saving costs both preserves the resource and improves efficiency, making the remediation more sustainable.
6.4.1 Cost-Efficiencies
Cost-efficiencies should be considered during P&T system optimization evaluations. This may include one or more of the following:
- Reduce the life cycle of the remediation alternative to reduce the environmental/carbon footprint and costs.
- Perform a cost-benefit analysis to determine whether capital costs applied now will reduce the long-term life cycle costs.
Publicly available quantitative evaluation tools estimating use of energy, water, landfill space, and greenhouse gas (GHG) emissions are available and would need to be paired with cost-estimating tools to evaluate the relative cost-benefit analysis of the remedial solutions and optimization efforts being considered. Quantitative tools for estimating use of energy, water, and landfill space consumption and GHG emissions include the following:
- Available tools:
- Sustainable Remediation Tool (SRTTM )
- SiteWiseTM, Version 3.2
- Envision SP
- Sustainable Energy Finance Association
- CRC Care—an Excel spreadsheet tool for quantitative evaluation, which includes an evaluation of remedy effectiveness, GHG emissions, ecosystem services, and effect on low income/disadvantaged people (an Australian guide)
- Recycled GAC can provide cost savings versus using virgin GAC, although some permits specify that virgin GAC must be used
- Guideline for Performing Cost-Benefit and Sustainability Analysis of Remedial Alternatives, Version 2
For some examples with cost data see the case studies in Appendix B.
6.4.2 Return on Investment
The tools listed in 6.4.1 each evaluate a variety of sustainable and resilient parameters (not all look at the same parameters); in some cases, this includes costs. The SRT tool, while not a cost-estimating tool itself, facilitates cost evaluations. SiteWise allows evaluation and comparison of optimization alternatives that differ in the use of alternative fuel or energy sources and evaluates the time needed to recover capital costs for the switch. The potential cost-benefit to a P&T project from switching to or supplementing fuel and energy sources depends on the expected life cycle of the project. Location-specific parameters and circumstances play a key factor, including the price of electricity in certain regions. These types of cost evaluations are helpful when evaluating the return on investment and deciding whether to move forward with evaluated remedial technologies or optimization methods.
Proprietary programs are available from several private consulting firms. The Air Force Center for Environmental Excellence (now the Air Force Civil Engineering Center—Environmental Restoration) RPO and RPO Inventory and Prioritization Software (RIPS) are two programs that were used to optimize remediation systems and reduce life cycle P&T costs and overall remediation costs. A reduced life cycle results in fewer emissions during remediation, further preserving resources.
6.4.3 Methods to Reduce Costs and the Carbon Footprint and Improve Cost-Efficiencies
Methods for reducing costs and the carbon footprint of a project and improving cost-efficiencies are listed below:
- Switch to VFDs for larger pumps to reduce energy use.
- Add recirculation at the treatment train to improve reaction and reduction of contaminants, reduce pumping, and improve the quality of discharged water.
- Use alternatives fuel sources at sites. For example, add solar arrays if property is available or use solar-powered NAPL recovery systems at remote locations to reduce emissions and infrastructure.
- Optimize extraction rates (as discussed in other sections) to reduce fossil fuel use and associated costs.
- Switch from air stripper and vapor-phase GAC (VPGAC) off-gas treatment to strictly liquid-phase GAC (LPGAC).
- Tie the P&T system into the redevelopment solar grid to offset emissions and operate more sustainably.
- Reduce or eliminate discharge of treated groundwater, allowing for reuse (gray water) or reinjection to conserve the resource.
- Reuse treated groundwater to create a saltwater intrusion barrier between oceans or high-salt content freshwater and drinking-water extraction wells.
To see examples of cost considerations or cost savings from sustainable resilient remediation (SRR) case studies, please see the green remediation case studies page (https://www.clu-in.org/greenremediation/profiles).
6.4.4 Energy-Efficiency Example—USACE Experience
USACE prioritizes cost-effective investments and energy-efficiency improvements in its infrastructure to reduce energy intensity and works to incrementally decrease facility energy use through Federal Energy Management Program (FEMP) guidance and training of local facility energy managers. Facility energy managers undergo two training courses: Section 432 of the Energy Independence and Security Act of 2007 (EISA 432) specialized training and Association of Energy Engineers (AEE) Certified Energy Manager (CEM) government-focused training. EISA 432 training reinforces documentation requirements and trains managers on how to use the EISA 432 compliance tracking system (CTS). The AEE CEM training is mandated training for covered facility managers that teaches staff how to perform energy assessments and minimize energy usage at their facilities.
USACE has continued to plan for and execute energy conservation measures (ECMs) annually to reduce energy intensity. In FY19 and FY20, natural events, such as increased use of pump stations during floods, continued to cause significant variations in USACE-wide operations and therefore impacted energy consumption and mission requirements. Due to restrictions caused by the nationwide COVID-19 response, a significant number of USACE facilities closed beginning in March 2020. These closures caused several scheduled training courses to be postponed or canceled, including one for CEMs. Despite these variations in operational tempo, USACE achieved the following in FY19 and FY20:
- Executed approximately 76% of the Civil Works O&M plans for energy-efficiency investments in FY19.
- Adopted General Services Administration (GSA) area-wide contracts, where feasible, to reduce energy costs.
- Held two training sessions with the FEMP for energy managers to document ECM savings in CTSs.
- Reviewed the 5-Year Metering Plan and continued to make updates to the appropriate buildings inventory to support progress and year-end reporting.
In FY21 and FY22, USACE will carry out the following priority strategies and planned actions:
- Update and implement the USACE operation order focusing on the 5-Year Metering Plan consistent with all federal guidance.
- Continue to make cost-effective investments in infrastructure and execute at least 95% of all civil works O&M plans for energy-efficiency investments annually.
- Continue to adopt GSA area-wide contracts, where feasible, to reduce energy costs.
- Continue to use commercial utilities programs to renegotiate utility rates and utility service contracts.
- Continue to train and designate energy managers for all USACE-covered facilities and ensure that all energy managers have access to complete and accurate energy data to inform energy management decisions.
- Further develop dashboards using the energy data visualization capability provided by the Corps of Engineers Reduced and Abridged FEMP Tool (CRAFT) to inform decisions regarding energy-efficiency investments.
6.5 Resiliency to Climate Change
From ITRC’s SRR document, “Resilience is the capacity of a community, business, or natural environment to prevent, withstand, respond to, and recover from a disruption ( USEPA 2020 [PFJY3BQ6] USEPA. 2020. “Sustainable and Healthy Communities: Strategic Research Action Plan 2019-2022.” U.S. Environmental Protection Agency, Office of Research and Development. https://www.epa.gov/research/sustainable-and-healthy-communities-strategic-research-action-plan-2019-2022. ). Understanding resilience requires an understanding of vulnerability…” ( ITRC 2021 [MVXSX8BV] ITRC. 2021. “Sustainable Resilient Remediation.” Washington, D.C.: Interstate Technology & Regulatory Council, Sustainable, Resilient Remediation Team. https://srr-1.itrcweb.org/. , Section 2.1.3). ITRC’s SRR document addresses how the entire site is impacted by the environment (resiliency) and how the site impacts everything around it (sustainability). For the purposes of this document, we are considering the resiliency of the P&T system, including but not limited to the hardware, electronics, and power sources that are part of the site remediation.
This section describes different areas that need to be considered during optimization to ensure resiliency of these systems. A system that is not resilient is subject to disruptions and downtime and has the potential for uncontrolled releases of hazardous material, both from the original discharge and the chemical stored and used on site to treat the groundwater. This, in turn, impacts sustainability, and releases beyond the site boundary can impact sensitive receptors and the nearby communities.
6.5.1 Climate Change Resilience
Climate change can have a variety of potential impacts on P&T systems: “Weather phenomena (heat waves, droughts, tornadoes, and hurricanes) that occur at the extremes of the historical distribution and are rare for a particular place and/or time, especially severe or unseasonal weather” ( ITRC 2021 [MVXSX8BV] ITRC. 2021. “Sustainable Resilient Remediation.” Washington, D.C.: Interstate Technology & Regulatory Council, Sustainable, Resilient Remediation Team. https://srr-1.itrcweb.org/. , Appendix F). For example, periods of extended drought can cause groundwater tables to drop, resulting in monitor, recovery, and discharge wells that may no longer be positioned correctly or screens that no longer support proper performance.
Resiliency actions are specific to the risks inherent to the individual P&T system. A resiliency example for a recovery well would be to compare well design and as-built conditions to the current groundwater profile. If the screens are no longer positioned where the contaminated water is located, then the efficiency of the recovery will be reduced or eliminated. If this happens to existing wells, redesign and installation of new wells may be necessary to achieve cleanup goals. In areas of prolonged drought, the design of new recovery wells could include multiple, independent, screened interval, or packer systems that can be adjusted.
Another example deals with flood risk. P&T systems are usually powered by electricity and controlled by SCADA systems. Original designs may not have considered the flood frequencies or water levels experienced today. During optimization, evaluating the frequency and intensity of past storms and projections for future weather patterns might lead to the recommendation to raise the elevation of the power supply and SCADA components. Raising the elevation of such infrastructure should be considered wherever power is supplied and automated control systems are located.
6.5.2 Evaluating and Optimizing Pump and Treat under Extreme Weather and Climate Conditions
Extreme weather conditions in this section include weather conditions that were not planned for at the time a remediation system was first evaluated, designed, or built. Many P&T systems were designed and built decades ago. Over time, weather and climate impacts have changed. This section identifies some of the risks to remediation posed by these changes and identify the resources needed to help stakeholders address the impacts as part of the optimization process. The key to addressing impacts from extreme weather and climate changes is to build these conditions into the site uncertainty analysis to optimize a P&T system’s resilience to these conditions.
ITRC’s 2021 SRR publication identified a range of extreme weather and climate conditions that can impact site remediation. The document recommends that these conditions be addressed during system optimization and provides the recommended BMPs for optimization (see ITRC 2021 [MVXSX8BV] ITRC. 2021. “Sustainable Resilient Remediation.” Washington, D.C.: Interstate Technology & Regulatory Council, Sustainable, Resilient Remediation Team. https://srr-1.itrcweb.org/. , Section 6.4.5.3 Optimization). In addition, the SRR publication provides a series of what the SRR Team calls sustainable best management practices (SBMPs) for the identified range conditions that may threaten the site remediation process ( ITRC 2021 [MVXSX8BV] ITRC. 2021. “Sustainable Resilient Remediation.” Washington, D.C.: Interstate Technology & Regulatory Council, Sustainable, Resilient Remediation Team. https://srr-1.itrcweb.org/. , Section 7. Key Sustainable Best Management Practices for Sustainable Resilience to Extreme Weather Events and Wildfires). These SBMPs can be used in the optimization analysis to address these threats.
For the purposes of this document, drought, flooding, and sea level rise are discussed as examples of threats that optimization stakeholders need to consider. This is not meant to be a list of all the threats; they are simply examples of how to get the threat consideration thought process started.
6.5.2.1 Drought
Drought can cause several threats to a remediation system. Every site has site-specific conditions that will generate a range of optimization alternatives. A few drought-related considerations to help the optimization team begin thinking about drought as a risk are listed below:
- Fluctuating water levels
- Monitor wells may need to be modified or replaced to access groundwater as it drops. Alternately, water may rise to levels above the well screen, which would also require well replacement or modification. Section 5.9 discusses well considerations.
- As water level changes, risk pathways for vapor intrusion may change. New pathways may open up or close depending on the nature of the changes. Vapor intrusion monitoring or controls may need to be modified to address these changes.
- Water allocation for the remediation system may change. Many areas, especially in the western United States, highly regulate how groundwater may be extracted, including for remediation systems. They also regulate what may be done with the treated water. Optimization options may be impacted by the current or projected future conditions, which must be included in the remediation risk analysis.
- Site Water Needs
- Treatment systems need process water, for example water needed to dilute process chemicals, backwash filters, and general cleaning. As the climate changes, water may need to be trucked in for projects that initially had enough water for these on-site needs.
- Capping systems for waste containment often have a vegetative layer. Was the vegetative layer designed to be drought resistant? Planning drought-resistant cover, which often consists of native plants, can help maintain the cap by minimizing erosion.
- Sanitary and health and safety considerations, such as for restrooms, decontamination, and showers, need to be evaluated and alternatives provided if public water supplies become limited or inaccessible. Reuse of treated groundwater should be considered for these functions.
- Wastewater/Treated Groundwater
- Optimization during the O&M phase is a good time to reevaluate discharge options for wastewater or treated groundwater. Have water conditions changed since the original design was developed? Is the site now in an area of drought conditions? Can the discharge water be a better resource? If it was a discharge to surface water, is it now a better resource for recharging the aquifer—can it be changed to discharge to groundwater? Was the original design a discharge to a POTW but local needs now dictate a need for more water? Can this water now be discharged to a surface water body or used as process water in the treatment system or otherwise reused? One example is a RCRA corrective action remediation site in New Jersey that discharges treated water to a surface water body (a pond) that is used as irrigation water for a golf course ( USEPA 2022 [JNXKMFAI] USEPA. 2022. “Hazardous Waste Cleanup: Lenox China Incorporated in Pomona, New Jersey.” https://www.epa.gov/hwcorrectiveactioncleanups/hazardous-waste-cleanup-lenox-china-incorporated-pomona-new-jersey. ). This alleviates the need for the golf course to use water from the existing sensitive aquifer for irrigation purposes.
- Integrate treated water with municipal potable water supplies. Examples includes the Newmark Groundwater Contamination Site in San Bernardino, California and the North Indian Bend Wash Site in Scottsdale, Arizona.
6.5.2.2 Flood
Flooding presents a range of risks to site remediation projects. Each site has a particular flood risk profile. Some sites are subject to direct-flowing flood waters. Others are subject to inundation, and yet others are subject to saline water flooding that is flowing, inundating the site, or both. Optimization teams should compare the conditions originally anticipated during the design phase to the actual conditions during the life of the project and attempt to project how future risks may change. Some examples are provided below:
- Flowing Flood Water
- Risks include direct damage from flowing water, cap erosion, bank erosion, and direct kinetic damage to buildings and structures from the flowing water or debris in the water.
- Inundation
- Even if the water is not flowing, inundation presents a threat to buildings, foundations, electrical supply and control components, mechanical control systems, computers, and control centers. For example, if the system uses compressed air, air compressors are particularly susceptible to water damage. Optimization recommendations could include raising compressors to a mezzanine level or adding berms or temporary (deployable flood barriers) flood abatement to protect critical equipment such as compressors.
6.5.2.3 Sea Level Rise—Saline Conditions
Sea level rise and the companion concept saltwater intrusion have special risks to P&T systems ( USEPA 2022 [2PHPY9KT] USEPA. 2022. “Climate Adaptation and Saltwater Intrusion.” Preprint, U.S. Environmental Protection Agency, Climate Change Adaptation Resource Center (ARC-X). https://www.epa.gov/arc-x/climate-adaptation-and-saltwater-intrusion. Water Resources 2019 [FB4YZEPS] Water Resources. 2019. “Saltwater Intrusion.” Preprint, USGS. https://www.usgs.gov/mission-areas/water-resources/science/saltwater-intrusion?qt-science_center_objects=0. ). Sea level rise is due to a combination of rising sea levels and subsiding coastlines ( Virginia and West Virginia Water Science Center 2018 [9CHJL8DL] Virginia and West Virginia Water Science Center. 2018. “Monitoring Land-Surface Deformation in the Virginia Coastal Plain.” USGS. https://www.usgs.gov/centers/virginia-and-west-virginia-water-science-center/science/monitoring-land-surface-deformation. ). Saltwater intrusion arises from the sea level rise and increasing demand for water, reducing the amount of freshwater that would naturally hold back saline waters. Figure 6-3 shows the most direct of the impacts to a pumping system, and examples of potential impacts on the system are listed below:
- Flooding of sea or brackish water has the added element of being a continuing threat to electrical components and systems due to the salts that are left behind even after initial drying.
- Optimization options include raising threatened components above projected flood levels or sealing or waterproofing sensitive components.
- Metal corrosion may occur throughout the system due to the salts that are left behind even after initial drying. Materials selection during design may not have taken saltwater contact into consideration.
- Optimization options include using salt-resistant coatings, paints, or epoxies and replacing susceptible piping, pumps, or other equipment with equivalents made of salt-resistant materials.
- Groundwater chemical composition changes may require reevaluation of treatment chemicals for effectiveness and efficiency. Ensure that the chemicals in use are still effective and efficient at preventing discharge exceedances. Alternatively, a review of discharge exceedances over time, the frequency of exceedances, and chemical consumption rates will indicate whether treatment adjustments are needed. Track chemical consumption rates over time because unexpected reductions or increases indicate a need for evaluation.
- Optimization options include changing the chemical dosages or finding a new chemical that will not be impacted by salts. This could require treatment method changes (e.g., can salt water be discharged as originally designed, or does the salt water itself now require treatment?) This may require bench or pilot testing to determine what changes are needed.
- Pumping water for remediation in the saltwater–freshwater interface zone can cause impacts and must be considered carefully. See resources for additional information.
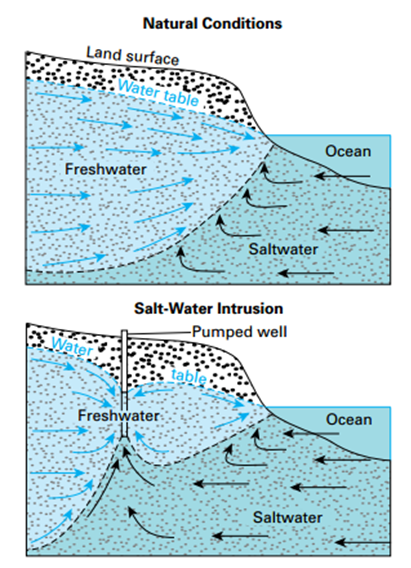
Source: Adapted from the United States Geological Survey (USGS), Water Resources Mission Area. March 2, 2019. https://www.usgs.gov/mission-areas/water-resources/science/saltwater-intrusion
6.5.3 Incorporating Resiliency Criteria into Pump and Treat Remedy Decision-Making
Climate impacts are wide ranging, and the specific climate impacts to a given site can be anticipated. Optimization reviewers need to identify those impacts and site-specific risks in their evaluations. Past impacts, current threats, and future risks need to be evaluated within the framework of the given remediation. Time is a critical component of this risk, and determining how long the remediation is expected to continue is key. The risks for the expected duration of the cleanup should be forecasted.
Adding sustainability to the optimization evaluation can be within the scope of optimization reviewers. The anticipated risks to the site can be evaluated and ranked, and recommendations to mitigate the risk can be made—this is resiliency or climate adaptation. Sustainability can be a multi-part evaluation. Three areas of consideration with potential questions to be answered by the optimization team are listed below:
- Schedule and duration: Can the remediation be completed within the projected time frame with the available resources? Are resources available for the project life cycle? Optimization reviewers typically evaluate costs to date, how much is being expended on the remediation, and whether the “burn rate” is stable, increasing, or decreasing. It is a sound step to report this in the optimization review along with the project’s costs before and after optimization. Costs would also include human resources.
- Planning with the end in mind: What will be the condition of the site when the remediation is completed? How will these conditions impact the community (human and environmental) surrounding the site? Will the resiliency built into the site be of value to the community or be an obstacle to redevelopment, ecological restoration, or preservation? For example, a site near a river may deploy armoring to prevent bank erosion into a contaminated zone. Once the remediation is complete (assume “clean, clean” in this example), will the armoring system (e.g., rip rap of gabion cages) remain in place, or will that present an obstacle to public use of the waterfront? This may or may not be outside the scope of optimization, depending on the scope. The optimization reviewers should identify the conditions that should remain when the site work is complete. The review can identify who is responsible for maintenance or restoration. These points of information will aid sustainability determinations.
- Stakeholder considerations: Will the post-remediation conditions be acceptable to the regulatory and stakeholder communities? Without a level of compliance with regulatory standards or stakeholder expectations, the remediation will not be sustainable. Optimization evaluators should make an honest assessment of the goals of the remediation and determine whether they believe they can be accomplished with the existing system(s) and plans that are in place. See Section 8 for more on stakeholder considerations.
6.6 Well-Network Design / Retrofit Considerations
Wells and well networks are susceptible to climate-driven risks just like the aboveground portions of a P&T system. To address these risks, resiliency should be built into the well and well-network design either during upfront design or during retrofits based on optimization recommendations. This section will identify some of the potential risks to wells and well networks and make recommendations on how to make the well systems resilient. We cannot stress enough that these are examples that may or may not apply to a particular site. Optimization reviewers need to evaluate the particular risk profile of the P&T system undergoing optimization.
6.6.1 Risks to Wells and Well Networks
|
Not all risks apply to all sites. Not all sites within risk zones need to implement all the suggested risk mitigation measures. Each site has its own risk profile, expected life expectancy, and threat profile to the environment and human health. This section identifies some of the common risks to wells (monitoring and recovery) and well networks at remediation sites. Some of the suggestions may be “too much” for one site but remain “not enough” for others; remediation risk management depends on in-depth knowledge of the site and anticipation of current and future site-specific risks based on sound scientific and engineering evaluation ( ITRC 2011 [U4PDZV64] ITRC. 2011. “Project Risk Management for Site Remediation.” Washington, D.C.: Interstate Technology & Regulatory Council, Remediation Risk Management Team. https://itrcweb.org/Guidance/GetDocument?documentID=88. ).
6.6.1.1 Flooding
Wells and well networks by their very nature are frequently located in low areas of sites such as near water bodies or close to, or in, marshes. They are placed in those locations because that the water body might be an actual or potential receptor for the site contamination, or perhaps because it is the last accessible location downgradient or to the side of the gradient. Similarly, many sites are located on or near water bodies as they were, or are, industrial sites that needed water for process uses, wastewater disposal, or transportation of raw materials and product. The proximity to water, a past or current benefit, now acts as a significant threat due to rising water levels and changing precipitation patterns. The risks associated with flooding include the following:
- The protective casing or the well casing itself may be damaged by flood debris.
- The well may be buried by flood debris or sediments.
- Contaminated floodwaters may infiltrate the well.
- Telemetry or well controls may be submerged (this is a particular issue with recovery wells or monitor wells with dedicated sampling equipment installed).
Risk mitigation suggestions are tagged, e.g. |
Flood mitigation for monitoring and recovery wells should include the following considerations:
- Take care to site wells outside of known or potential flood zones, if possible. (Design)
- If it is not possible to site or relocate wells outside of flood zones, what alternatives can be considered?
- Sampling or maintenance platforms may be needed in extreme situations and may be more cost-effective than having to replace damaged or lost wells. (Design, Retrofit)
- Flush-mounted surface completion might be an advantage in areas where floodwaters may be fast flowing and contain debris that might damage or wash away the protective casing. (Design, Retrofit)
- Installation of redundant wells may not be a viable alternative, especially when it comes to recovery wells. If a site cannot tolerate even short periods of downtime, the site probably needs another backup technology, such as slurry wall installation (for preventing off-site migration) or a vault completion for the well to prevent damage from floodwaters.
- Physical barriers can be installed such as bollards, which are commonly used to prevent well damage due to vehicles and can also block or catch flowing debris. Physical barriers also enhance well visibility when locating wells after a flood event. (Design, Retrofit)
- Redundant wells can be installed, although this may be expensive. A set—or partial set—of wells can be placed in an area of the site out of harm’s way; this might keep the system up and running while lost or damaged wells are being rehabilitated or replaced. Some sites cannot tolerate even short periods of downtime. Recovery wells are sited for optimal performance, but there might be options, depending on the site. (Planning, Retrofit)
- Controls and electrical supply junctions should be placed above anticipated flood levels, and maintenance and operator platforms should be located as needed to ensure safe operation. (Design, Retrofit). Locate controls remotely if necessary or use minimal controls at the well head, such as shut-off or lock-out controls. (Design, Retrofit). Relocate pump lifts away from flood zones. (Pre-event Planning)
- Ensure that well-fitted and tightened gripper plugs are installed prior to flood events to prevent direct infiltration of flood water into the well. Take care to ensure the fit is tight because rapidly rising groundwater due to the flooding will apply pressure to the cap and may cause it to pop out of the casing if it is not tightly fitted. (Planning, Pre-emergency Checklist)
- Ensure that all wells are properly surveyed, and the location data are safely stored off site. (Pre-emergency Checklist, Post-event Recovery)
- Dedicated sampling equipment that might extend beyond the well casing should be anchored. Telemetry devices and antennae should be raised above anticipated flood zones. (Planning, Retrofit)
6.6.1.2 Wildfire
Fire is not a major risk for monitor wells. Fire can, however, damage accessory structures, instrumentation, telemetry, and controls (which are not common at monitor wells). If subject to direct fire, identifying information may be lost if it is not permanently affixed to the well or embedded in the well collar. Wildfire risk mitigation for monitor wells includes the following considerations:
- Using stamped stainless-steel panels or tags is recommended because painted, marked, or stenciled well numbers can be burned off the casing or cap. (Retrofit, Post-event Recovery)
- Keeping brush or other combustible vegetation at least 5 feet from the well will mitigate fire risk. (Pre-event Planning) ( NFPA 2022 [B7JSE9SY] NFPA. 2022. “Wildfire Research Factsheet - Immediate Noncombustible Zone.” National Fire Prevention Association, Insurance Institute for Business and Home Safety (IBHS). https://www.nfpa.org/Public-Education/Fire-causes-and-risks/Wildfire. )
Wildfire risk mitigation for recovery wells includes the following considerations:
- During optimization, review operating procedures to determine whether pre-event planning has been developed. Recovery wells often have aboveground control panels and wiring.
- Ensure that all brush or combustible material is cleared from the area (5-foot minimum) around control panels and appurtenances.
- Do not site or place flammable material storage, closets, sheds, or other storage near pump controls or near electrical supply and distribution equipment. (Pre-event Planning)
- Plastic (including HDPE and PVC) will melt if exposed to fire. Consider following materials specifications carefully for aboveground well and system piping components in fire zones. (Design, Pre-event Planning)
6.6.1.3 Permafrost Thaw and Other Cold Weather Damage
Permafrost thawing is one threat from increasing global temperatures. Shifting of once solid or frozen soils can cause wells to shift or break. Wide swings in temperature also cause another threat, frost jacking. Wide swings in temperature and freeze thaw cycles can cause an effect known as frost heave ( Manz 2011 [VJ6YCUI9] Manz, Lorraine. 2011. “Frost Heave.” North Dakota Geological Survey. Geo News, July. https://www.dmr.nd.gov/ndgs/documents/newsletter/2011Summer/FrostHeave.pdf. ). This can be severe, and examples of frost heave moving as much as 2 feet per year have been observed. Frost heave on an isolated structure such as a monitoring well can result in the structure moving. It may move differentially; the casing can separate from the protective casing, moving the screened interval out of position and damaging and possibly destroying the integrity of the casing or screen. At the very least, the movement will cause errors in the depth to groundwater measurements. Wells in areas subject to permafrost loss or frost heave require special monitoring. The Alaska Department of Environmental Conservation has a fact sheet / technical memorandum that includes information on this topic, “Maintaining Monitoring Wells” ( AKDEC 2022 [Q6ZG78LL] AKDEC. 2022. “Maintaining Monitoring Wells.” Alaska Department of Environmental Conservation. https://dec.alaska.gov/media/6114/maintaining-monitoring-wells.pdf. ). The Alaska technical memorandum recommends an annual leveling survey to confirm measuring point elevations for all monitor wells.
6.6.2 Resilient Well Design
The design or optimization team can make use of websites like the USEPA’s Superfund Climate Resilience: Adaptive Capacity website to determine whether the site is at risk and needs specific design efforts to mitigate risk. The team should also take time to interview local officials, stakeholders, and site operators and workers on existing sites. These people will know whether conditions are changing; often they will have recommendations for preventive measures ( USACE 1999 [E6R8PNZW] USACE. 1999. “Remediation System Evaluations.” U.S. Army Corps of Engineers. https://www.hnc.usace.army.mil/Portals/65/docs/Directorates/EMCX/Checklists/Remediation System Evaluation.pdf. ).
If the conditions are changing and potential negative impacts would intersect with the projected life of the cleanup, the optimization team should identify those risks and recommend mitigation measures. When it comes to well design, some recommendations could include well materials and construction that can withstand physical changes such as frost jacking, physical damage from direct impacts such as flooding, or physical impacts that have the potential to increase the frequency of well redevelopment (damage to casings may open wells to silt or other contaminants). Resistance to saline water conditions may need to be considered at some sites. If new wells are recommended that might only be temporary due to, say, rising water conditions, less-expensive construction materials and techniques might be all that is needed. Multiple screened levels, or well nests (multiple wells with different screened intervals), might be considered if groundwater conditions are changing quickly.
See Appendix D for resiliency tools and resources for resilient well design guides.
6.6.3 Well Efficiency
Section 4 identifies the chemical and mechanical reasons for the loss of efficiency or productivity of wells and solutions for those issues. This section identifies some of the potential impacts of changing climate conditions and possible solutions.
6.6.3.1 Changing Groundwater Levels
Some regions will see water tables rise due to excess rainfall and flooding. Others will experience dropping water tables due to drought or increasing demand. The optimization team should evaluate the historic groundwater trends for the site and should consider the following questions.
- Is the water table rising or falling and at what rate?
- Is the rate increasing, decreasing, or staying constant?
- What are the projections for the region?
This evaluation is necessary to determine the risk to the existing well networks, recovery wells, and monitoring wells. In some regions, groundwater has dropped 50 feet or more ( USGS 2018 [FEF2D3VW] USGS. 2018. “Groundwater Decline and Depletion.” https://www.usgs.gov/special-topics/water-science-school/science/groundwater-decline-and-depletion. ). If wells were installed to that depth or lower or with screened intervals that match the current level, the wells may no longer be either efficient or effective. For example, DNAPLs may now be passing below the screened interval. In fact, the wells may no longer be functional at all. The optimization team will need to make recommendations as to which wells are still effective and which can be remediated (e.g., removed, over drilled, and reinstalled to the proper depth). In addition to well construction details, the optimization team will need to examine the impact of the groundwater changes on the aquifer(s) and assess whether it is still being impacted and whether new wells are needed. Can certain wells now be eliminated? The rate of change will be factored into well and well-network design recommendations. See Section 3 for more information on this topic.
Rising water tables create the need for a similar evaluation. Well screened intervals may now be fully submerged and may no longer be in the pathway of the contaminant stream. LNAPLs may be passing above the screened interval. Rising water tables, like declining water tables, may cause intersections between different aquifers. Rising water may now intersect with the surface (daylighting), causing new threat pathways (e.g., vapor intrusion) or potential impacts to surface water bodies. Well networks need to be evaluated against the new current conditions and conditions to come. There is no point installing an identical replacement well in the same location if it will only be effective or efficient for a few years when a plan can be made to anticipate changing conditions. Locations of replacement wells can be reconsidered if higher elevations are available. Redesign of the well, casing, screened interval, filter pack, etc. may be an option ( USEPA 2018 [LYWULL86] USEPA. 2018. “Design and Installation of Monitor Wells.” https://www.epa.gov/sites/default/files/2016-01/documents/design_and_installation_of_monitoring_wells.pdf. ). Elevating the casing and providing sampling platforms is also a possible alternative.
6.6.3.2 Changing Flow Directions
Groundwater flow direction can change over time. As noted above some regions will see increasing (gaining) groundwater and some regions will see decreasing (declining) groundwater resources. Both conditions can impact groundwater flow direction on their own. Another impact on groundwater flow is use. As surface-water resources decline and populations increase, demand on groundwater resources increases. As more water production wells are permitted, the impact on local and regional groundwater flow can change. As part of the CSM update, the optimization team should review the site file and the records of the local water board or equivalent for evidence of new production wells that may have come online. Ideally, well permitting agencies will have looked at the impact of new applications on surrounding wells, but that might not always be the case. A complicating factor, such as Superfund status and the use of permit equivalencies, may make it difficult for water use regulatory agencies to see the full picture of groundwater use in a particular area. Some regulatory enforcement units do not recognize equivalencies and do not review the data; instead, they rely on site remediation regulators to take on that role. An optimization team should keep this in mind when evaluating current groundwater flow by ensuring they interview the appropriate regulator. More information can be found on this topic in Section 4.2.3, Optimization under Changing Groundwater Flow Conditions.
6.6.3.3 Saltwater / Saline Intrusion
Changing water flows, groundwater, and surface water can influence the location of the saltwater intrusion line in the surface water and groundwater systems. If a system was built in a freshwater aquifer, or draws water from a freshwater surface water body, and now, due to changing conditions, the water is either brackish or fully salt, the treatment system probably has been or will be impacted. Impacts due to saltwater intrusion range from process changes (e.g., chemical consumption) to mechanical failure (e.g., pumps designed for fresh water may not last as long in salt water). Optimization teams need to examine raw water quality changes over time to make chemical adjustments and mechanical upgrade recommendations. The future of the site should be addressed; if saltwater intrusion is not a problem today, will it be in the future, and when? The site cleanup schedule should be compared to the progression of saltwater intrusion approaching the site, and the potential intersection of those timelines should be evaluated. If they do, the optimization team can make recommendations to identify when the intrusion becomes a problem and what to do about it.
See Appendix D for resiliency and sustainability resources for tools that can be used to protect water and climate impacts over time.
6.6.4 Monitoring
Resiliency considerations related to monitoring site conditions are presented in this section. Changing site conditions due to climate change impacts are varied and are very site specific, so optimization reviewers must consider site-specific conditions for the past, present, and the forecastable future when evaluating data and planning for revisions to the monitoring protocols. In general, typically wet areas are expected to get wetter and dry areas are expected to get drier ( Bhatia and Popovich 2021 [AC2H2ISM] Bhatia, A., and N. Popovich. 2021. “These Maps Tell the Story of Two Americas: One Parched, One Soaked.” The New York Times. https://www.nytimes.com/interactive/2021/08/24/climate/warmer-wetter-world.html. ). Rising water tables, declining water tables, and saltwater intrusion are used as examples of how to evaluate for optimization during this period of climate change impacts.
6.6.4.1 Rising Groundwater
Some regions will see rising groundwater conditions as a result of the impacts of higher-than-average rain and increasing flood threats. As groundwater rises, the risks to monitoring includes monitor wells becoming ineffective because wells originally designed with screened intervals at the groundwater interface line may find that now the entire screened interval is below the interface line. This becomes problematic if the contaminants can no longer enter the screen (e.g., LNAPLs may now ride the water table above the screened interval). For neutral buoyance contaminants or DNAPLs with well screens below the water table interface, the groundwater flow conditions may have changed; intermixing of subsurface zones may now be occurring and need to be reevaluated ( USEPA 1996 [2TN7BKC8] USEPA. 1996. “How to Effectively Recover Free Product at Leaking Underground Storage Tank Sites: Guide for State Regulators.” U.S. Environmental Protection Agency, Office of Solid Waste and Emergency Response. https://nepis.epa.gov/Exe/ZyPURL.cgi?Dockey=10000831.txt. ). The gaining aquifer may be driving DNAPLs deeper than they once were.
The worst-case scenario is that rising water will make wells inaccessible and unreliable. Ground that was once dry can now be under water either permanently or tidally. Accessibility for sampling and the reliability of the well to provide a representative sample are at risk.
Wells that are now under water are subject to influences they were not designed for originally. Well sealing during construction to inhibit surface water from entering the annular space may allow floodwater (with a higher head and longer duration than typical rainstorms) to breach the well seal, allowing surface water to mix with the groundwater. The surface water could be clean, causing dilution, or carry new contaminants with it into the subsurface, contaminating the well.
If the well construction is not in question and the well is truly critical for the monitoring plan, adding an extension to the casing and a protective cover to keep the well out of the water can be considered. Extensions to the casing will require surveying to establish the new levels (e.g., the top of casing), so measurement to bottom of well, depth to product, and depth to groundwater can be measured. Raising the ground level around the well or installing platforms for the sampling teams may be necessary.
If the well is truly inaccessible or the construction is questionable, relocation of the well to a protected area is advisable. Forecasts of future rises in the water table are needed to site the new well; there is no point relocating a well that will be required for a 30-year monitoring program when forecasts say the new location will be flooded within five years.
If wells are to be abandoned during the optimization process, proper abandonment procedures must be followed to prevent the potential for contamination from the abandoned bore hole and to properly record the decommissioning ( USEPA 2018 [LYWULL86] USEPA. 2018. “Design and Installation of Monitor Wells.” https://www.epa.gov/sites/default/files/2016-01/documents/design_and_installation_of_monitoring_wells.pdf. ).
6.6.4.2 Declining Groundwater
Declining groundwater tables present threats to the monitoring program as severe as rising groundwater. Water tables may drop below the screened intervals of the monitor wells. With the dropping water tables, soils might compress and cause subsidence around the well, exposing the well seal to the atmosphere and causing it to dry out and no longer effectively protect against the periodic rains and seasonal flood that might still be occurring.
Wells that have gone dry need to be evaluated. Are they still in a location that is critical to the monitoring effort? Is there still groundwater below the well that is in a zone of interest? (This will provide data relevant to the rebuild or decommission decision.) Are multiple zones now being exposed or potentially intermixing? (This will influence the design of replacement wells.) Removal of the casing and screen and over drilling the borehole to the new, deeper level is a probable option. The design of the new well will be influenced by the rate at which the water table is declining. If the water table is dropping rapidly (e.g., some areas are seeing declines on the order of feet per year), multilevel sampling points or samplers may need to be considered or multiple screened levels separated by packers ( USEPA 2018 [LYWULL86] USEPA. 2018. “Design and Installation of Monitor Wells.” https://www.epa.gov/sites/default/files/2016-01/documents/design_and_installation_of_monitoring_wells.pdf. ).* Nesting wells at different depths may also be considered.
The optimization reviewers need to understand the range of groundwater variability at the site, annual groundwater variation, variation over longer periods of time, and forecasts for the future to build in resiliency. Think ahead: What risks does this site face in the coming years? With those data, the optimization reviewers can recommend adaptations specific to the site.
Maintenance should be considered. Some optimization recommendations may cause maintenance needs to change. Consider and report all cost changes associated with optimization recommendations.
6.6.4.3 Saltwater Intrusion
Monitor wells face threats that are similar to those faced by recovery wells in a saline intrusion zone. Saline may physically damage the screened interval if the materials used to design the screen are not saline compatible. Galvanic effects of dissimilar metals used in well materials and fittings will cause corrosion ( Scroggins 2018 [PC73ZAM5] Scroggins, J. 2018. “How to Fight Saltwater Intrusion on Water Wells.” The Driller. https://www.thedriller.com/articles/91193-how-to-fight-saltwater-intrusion-on-water-wells. ). Increased well redevelopment may be necessary. However, increased redevelopment of increasingly weakening screens can be considered a short-term solution. Replacement of the well casing and screen with saline-resistant material could be an optimization recommendation. Dilution of the groundwater is a concern: Is the saline water coming from a zone that is also contaminated? Is uncontaminated, “clean,” water coming in that will cause dilution of the contamination zone? Is the new influence steady? Steadily increasing? Tidally influenced? All these questions will influence the optimization team’s recommendations for wells and monitoring protocols.
Saline water has different chemical components than freshwater, and if the system is not designed for the density of salt water, calibrations will be off. Sampling equipment may not be saline resistant, and the galvanic reactions can cause damage to the sampling equipment or instruments. Analytical protocols may differ for saline vs. fresh water; check the methods if saline is now an issue at the site.
6.6.4.4 General Monitoring Considerations
The greater the climatic change the more frequently groundwater monitoring should occur. The USGS makes this recommendation for water-level readings, and it makes sense for contaminant monitoring as well ( USGS 2001 [3C8JRTED] USGS. 2001. “Ground-Water-Level Monitoring and the Importance of Long-Term Water-Level Data.” https://pubs.usgs.gov/circ/circ1217/. ). Figure 6-4 shows the USGS strategy for when to update monitoring. Any of these factors can change over the lifetime of a site. In fact, any combination of these factors can happen over the lifetime of a site. Optimization reviewers can use Figure 6-4 and a checklist to determine whether additional research is necessary to make effective recommendations.
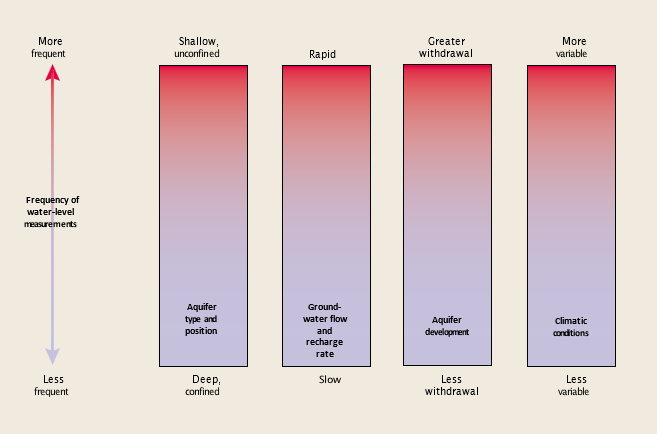
Adapted from: USGS. 2001. Ground-Water-Level Monitoring and the Importance of Long-Term Water-Level Data. https://pubs.usgs.gov/circ/circ1217/.
6.7 Climate Adaptation
Several sources of information and tools that may be useful to support teams assessing and addressing climate resilience are available. The USEPA’s Superfund web page has a climate resilience section with information about recommended considerations and approaches for adapting to climate change and building resilience to extreme weather at contaminated sites undergoing cleanup. The Agency’s Climate Change Adaptation Resource Center website includes broader information on climate resilience efforts and tools.
In 2019, the USEPA’s Superfund Program released three updated climate resilience technical fact sheets designed to help project managers and other cleanup stakeholders identify, prioritize, and implement site-specific measures for increasing remedy resilience to climate change and extreme weather events. These P&T-related fact sheets cover remedies and site types likely to have significant investments in remedy infrastructure, potential for contaminant remobilization, and longer operating periods. The fact sheets are listed below:
- Climate Resilience Technical Fact Sheet: Groundwater Remediation Systems
- Climate Resilience Technical Fact Sheet: Contaminated Waste Containment Systems
- Climate Resilience Technical Fact Sheet: Contaminated Sediments
The Federal Remediation Technologies Roundtable (FRTR) Fall 2021 meeting focused on climate resilience policies, actions, and tools. A collection of these resources is presented in a table in the FRTR report on the meeting ( FRTR 2020 [M6TQYWH3] FRTR. 2020. “Technology Screening Matrix: Groundwater Pump and Treat.” Federal Remediation Technologies Roundtable. https://frtr.gov/matrix/Groundwater-Pump-and-Treat/. ).
|
Key Takeaways Every site has its own profile of sustainability and resiliency concerns that can be included in optimization reviews. These can be informed by an updated CSM or prior optimization review or planned for in new optimization reviews. Sustainability and resiliency reviews do not have to be done solely during optimization efforts; they can be independent reviews. |

